
Many market analysts consider cryptocurrency markets as notoriously volatile. Volatility, however, provides an abundance of opportunities for traders. Yet, with increased volatility comes greater risk. Disciplined traders typically formulate a strategy for crypto trading and investments that navigate these often choppy markets. Since Capitalise.ai allows for an almost infinite amount of trading strategies, let’s start with how to easily automate three popular Crypto trading strategies.
Not only can these crypto trading strategies be tweaked to maximize profit, but they can be tested & automated very easily without any coding knowledge. The strategies discussed here are Range, Momentum, and Swing Trading.
Range Trading Using the RSI Indicator
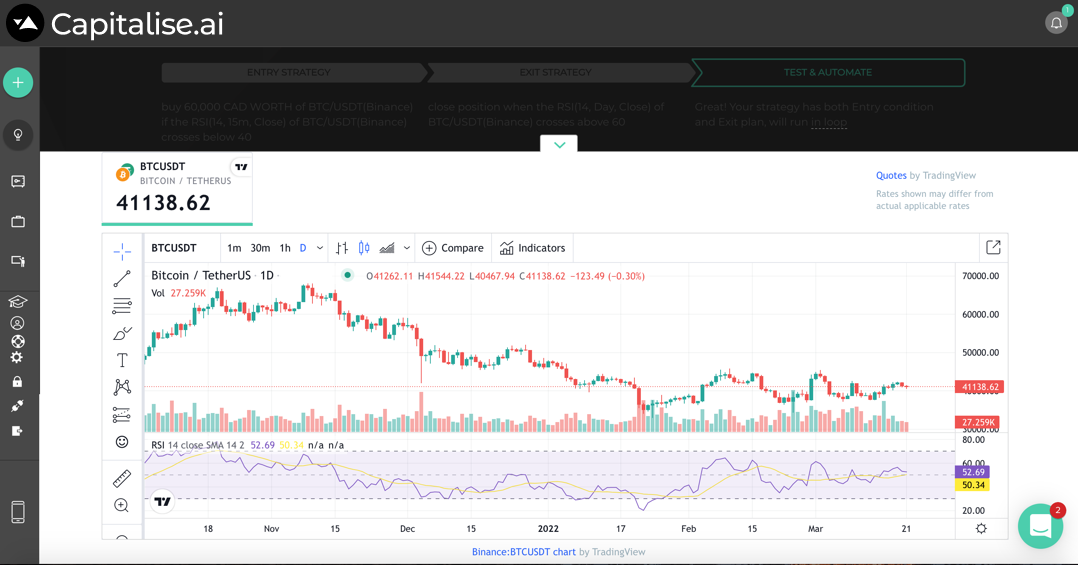
Typically, cryptocurrencies will trade within a defined range. This range is characterized by support and resistance bands. Essentially, range trading allows the trader to buy and sell when an asset is overbought or oversold. Some of the common indicators used for this type of trading are the Relative Strength Index (RSI), Stochastic Oscillators, and Support and Resistance Bands. If you are using the RSI, it is fundamental to know that it measures the speed and change of price movements, oscillating between zero and 100. Usually, a value below 30 is considered oversold and a value of over 70 is considered overbought, which can be used to trigger a buy and sell signal, respectively (see figure 1 below).
Now that we have identified an indicator that could fit our strategy, we should identify a non-trending market (i.e., an asset that is trending horizontally) so that the strategy does not get in on a range that is really part of a larger trend. To do so, one can use a moving average indicator on the timescale being targeted. Alternatively, the Average Directional Index (ADX) can measure the strength of a trend without considering its direction. It is presented on a scale from 1 to 100, with an index lower than 20 often considered a horizontal trend. Another crucial step to setting up this strategy is identifying the range area. Typically, one would want the asset to have recovered from the support band and peaked at the resistance band at least twice. This further ensures that you are trading within a sideways range and not a larger trend.
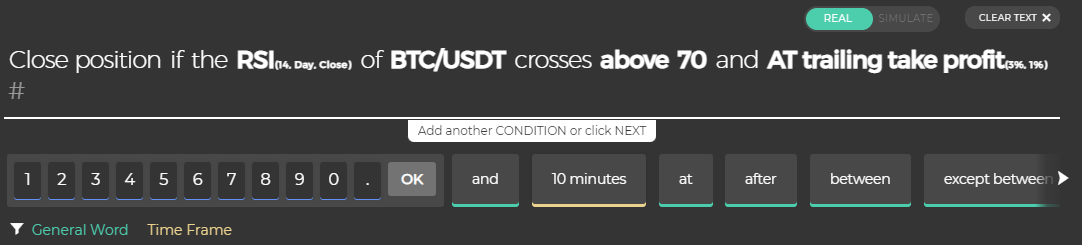
As for the exit scenario, it would seem logical in the context of our indicator to hold the position up until the asset reaches “overbought” conditions. Therefore, an exit strategy for the RSI indicator would close the position when the RSI rises above a certain index. Many traders consider it good practice to place stop orders outside of the trading range, like a trailing take profit (TTP). Using TTP allows the trade to continue its trajectory so long as it is profitable for the trader. Whichever crypto trading strategy or indicator you use, consider back-testing thoroughly while trying to avoid optimizing the strategy solely in historical terms (i.e., optimisation bias).
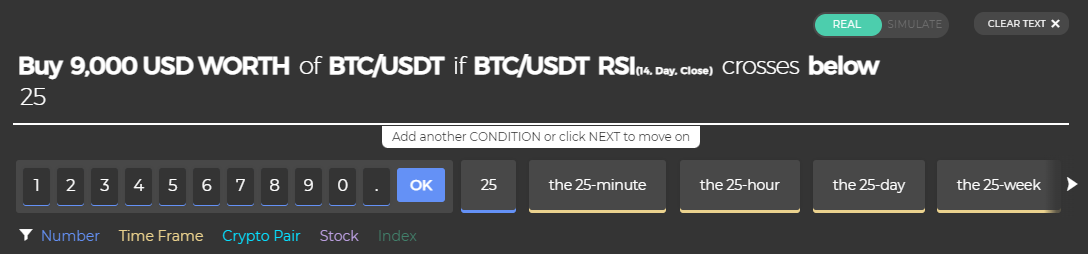
Here is an example of how you can automate an RSI-based strategy using everyday English with Capitalise.ai:
Entry Strategy
Exit Strategy
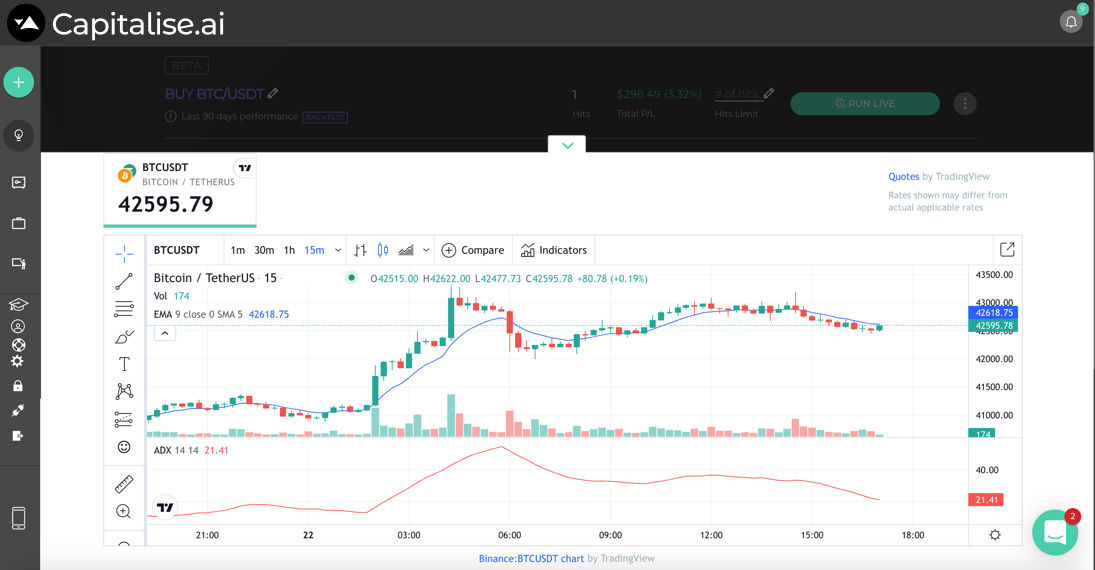
Momentum Trading on Price Change with Exponential Moving Average and Average Directional Index
Momentum trading measures the strength of an asset’s current trend through different indicators. This embraces the adage “The Trend is Your Friend.” These indicators help a trader go long on an asset while the price is believed to still be rising. Conversely, the same indicators indicate when some traders decide to sell at an assumed price peak . The rationale appears rather simple. If there shows a big enough force encouraging a price move, a likely continuation could attract traders who do not want to miss out on catching that wave. If you would like to learn more about the vast popularity and logic behind momentum trading, check out this fascinating research brief.
As one would expect, the primary task of momentum trading is to assess the strength of a trend before buying in. This assessment, and in turn, the entire strategy, rests on three fundamental metrics: trading volume, volatility, and timeframe. Some of the technical indicators commonly used for that assessment are the Average Directional Index (ADX), Moving Averages (MAs), Relative Strength Index (RSI), and Moving Average Convergence Divergence (MACD). This may at first seem overwhelming, but each indicator is simple when you drop the intimidating acronym. Here, we will focus only on two indicators to determine a momentous price change.
A popular momentum strategy considers an exponential moving average (EMA) and the ADX indicator. To enter a trade according to these technical indicators, one would wait until the ADX is at 30 or above, signaling a strong trend irrespective of direction. Then, if the EMA is pointing upwards, it is also suggestive of a trend, a perfect storm of sorts. You can see these indicators in Figure 1 below.
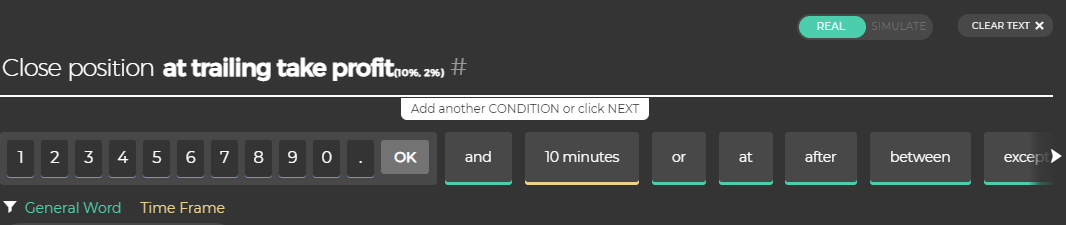
A potential exit for a strategy could be to take profits when the price of the asset crosses the EMA. The exit strategy below uses a Trailing Take-Profit instead. As mentioned above, the volume could often be a key factor when deciding on an exit signal. A higher volume tends to mean that there is stronger momentum and therefore serves as a more accurate indicator to enter a trade. When it comes to momentum trading, the following examples illustrate clearly how one might devise relative strategies:
Entry Strategy

Exit Strategy
Swing Trading with Bollinger Bands
Perhaps, swing trading serves as the most popular crypto trading strategy. Swing Trading suggests price movements of an asset rarely stay linear for long (like a momentum strategy would assume). In other words, swing trading attempts to take advantage of pullbacks and rallies in prices. Entries take place at the pullback and exits at the rally. These strategies can span multiple days or even weeks so long as there remains good reason to hold the position. Like all the other strategies mentioned above, this strategy category may also be based on any number of variations of technical and fundamental analysis.
If considering technical indicators heavily associated with swing trading, the Bollinger Bands (BB) steps up as prime candidate. When looking at a Bollinger Bands, observe three lines that define the upper and lower band. The middle line indicates a simple 20-day moving average (SMA) though the time period adjusts to your preference. The amount of candles determining the moving average adjust as well. The moving average also serves as a major line of resistance coming up from the lower band or a support of the upper band. The upper and lower bands represent the standard deviation of the SMA.
In other words, the two outer bands determine and predict the volatility and expected range of the trend. For some this serves as indicators for when a pullback or rally takes place. When the price of an asset pierces the upper band, the asset displays prices in an upward momentum/trend. Testing the top of the upper band could indicate a sell signal may be in order. When the price moves below the lower band, this could indicate the beginning of bearish downward trend. Possibly, testing or breaking past the bottom of the band indicated when a buy signal may be in order. A strategy need not incorporate both of those conditions for the entry and exit. They may, however, help a trader decide if they want to test or execute a buy or sell order.
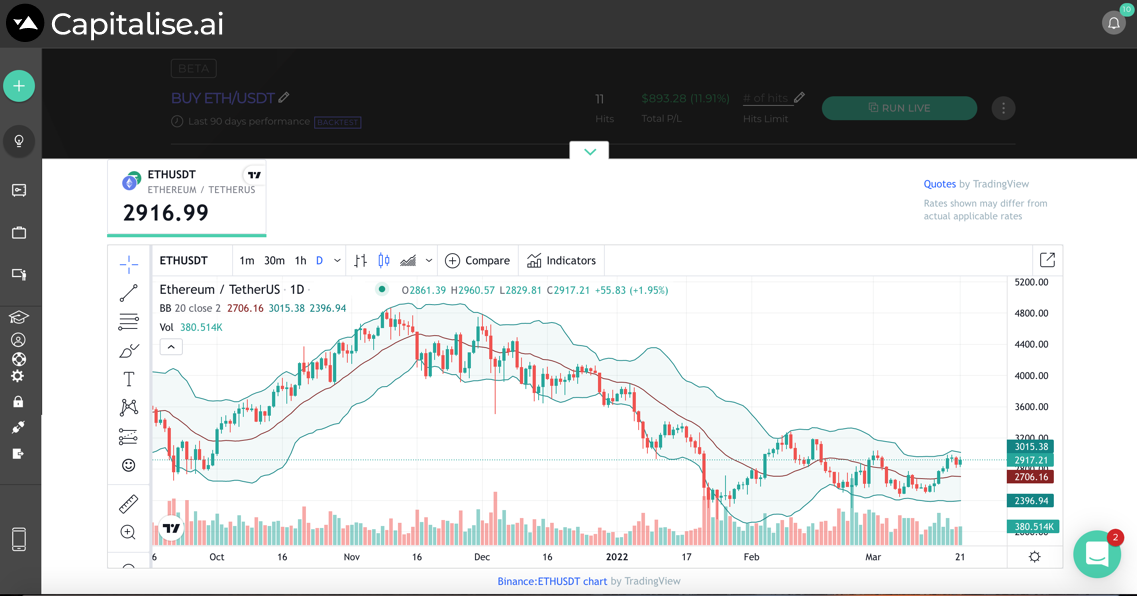
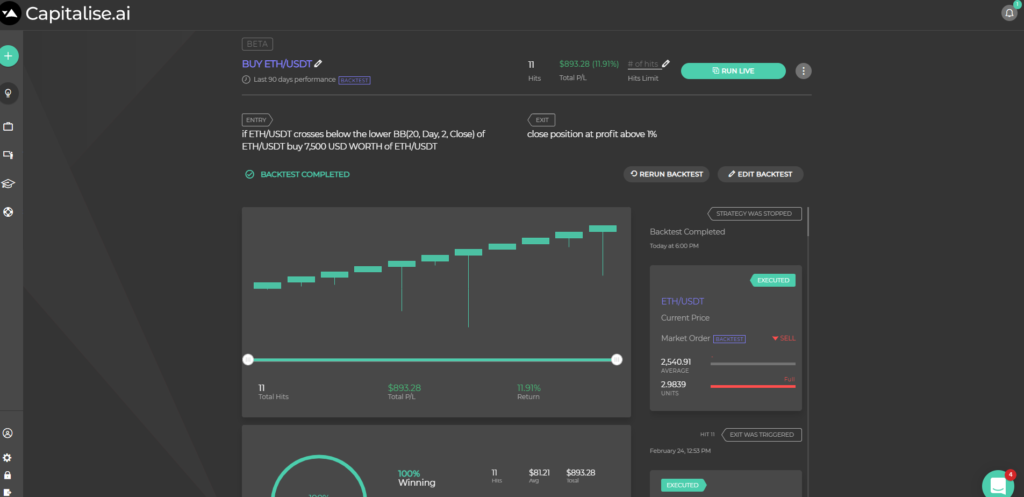
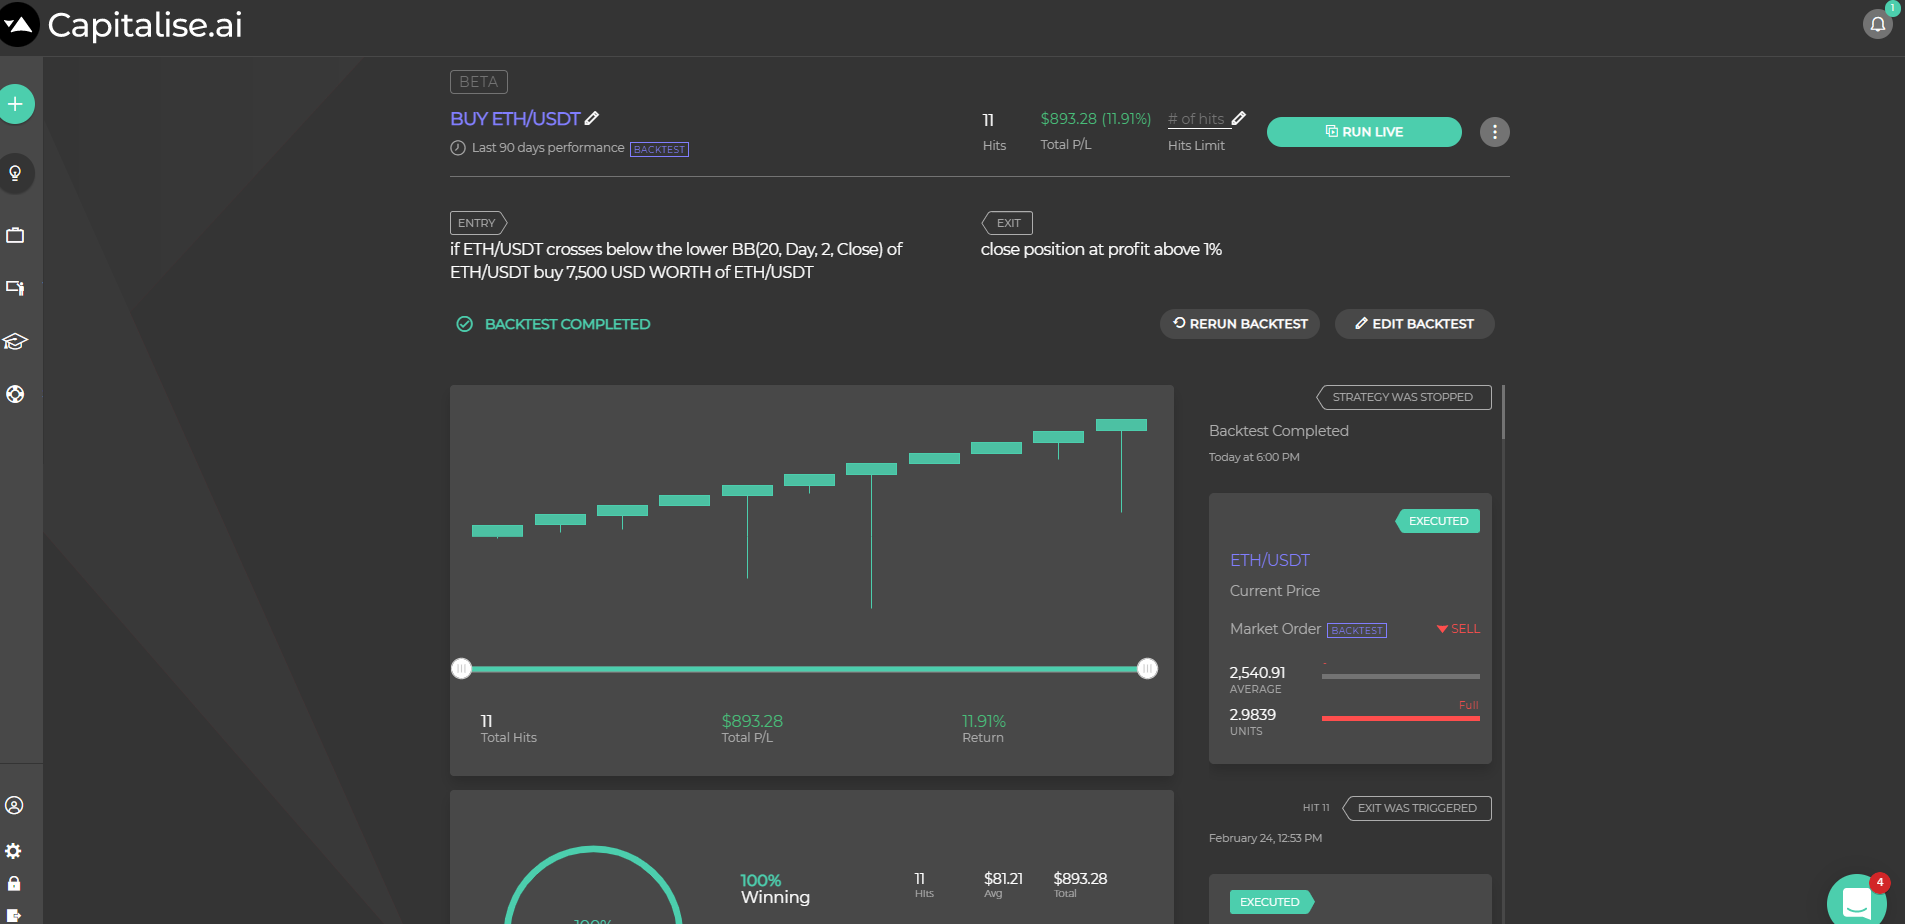
This back-testing strategy enters a position when the asset crosses below the lower Bollinger-Band. It closed the position at profits above 1%:
Up your crypto trading game with code-free backtesting and automation
With Capitalise.ai test and automate any trading scenario using a simple & intuitive interface. Our automated trading requires no coding or technical knowledge.
Simply type in your trading strategy in everyday English and Capitalise.ai monitors the markets 24/7 for you. Once your conditions occur, your trading orders transmit automatically to your trading account for execution.

