Strategy Templates
DISCLAIMER
DISMISS
Bear in mind that all of the examples you see here are just that — examples. Really, they're just here to show you how our platform works. So, don't take them as advice, instruction, or guidance.
Full disclaimer
The examples presented on this page, are only to be regarded as a technical demonstration when used with the trading system. Accordingly, these examples should not be in any way construed as recommending any type of trading strategy and they do not constitute any form of advice as the advisability of investing by the use of any trading strategy. Any Investor who uses the trading strategy must build a trading strategy on the basis of independent testing and according to his / her specific requirements and needs.
Tech Indicators
Price Action
Timing Conditions
Smart Trades
Candlestick Patterns
DCA
TradingView
Smart Notifications
Tech Indicators
Set your entry and exit conditions based on popular indicators. Combine multiple indicators to create your custom trading strategy.
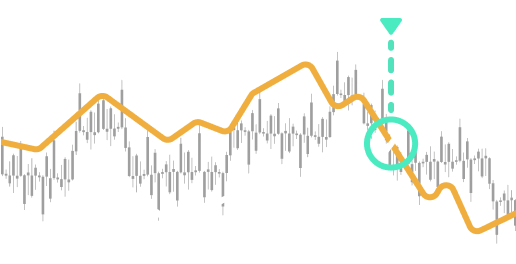
MA Crossing
This strategy waits for a trigger once a short moving average of 10 bars crosses above the long moving average of 30 bars
Read More

If BTC/USDT MA(10, 1h, Close) crosses above the BTC/USDT MA(30, 1h, Close) then buy 1,000 USD WORTH of BTC/USDT
Close position if the MA(10, 1h, Close) of BTC/USDT crosses below the BTC/USDT MA(50, 1h, Close) or AT profit above 5%
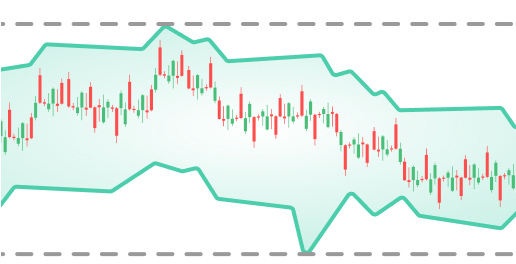
Bollinger Bands Ping Pong
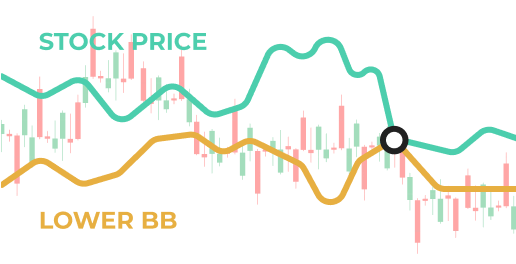
Entering position When price drops below the lower band on the 1 hour chart. Exiting the trade once the price has returned to the middle Bollinger band or at a loss of 3%
Read More
If BTC/USDT price crosses below the lower BB(20, 1h, 2, Close) buy 5,000 USD WORTH of BTC/USDT
Close position if BTC/USDT is above the middle BB(20, 1h, 2, Close)
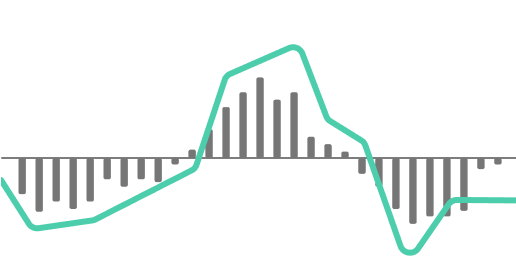
MACD VS. the Signal Line
Enter & exit positions based on the MACD indicator. In this example we will enter a long position if the MACD line is above 0 and crossing above the signal line.
Read More
Buy 1,000 USD WORTH of BTC/USDT if the MACD Line(12, 26, 9, 15m, Close) of BTC/USDT crosses above the signal line and the MACD Line(12, 26, 9, 15m, Close) of BTC/USDT is above the zero line
Close position if the MACD Line(12, 26, 9, 15m, Close) of BTC/USDT is below the signal line or profit is at 15% or the loss is at 6%
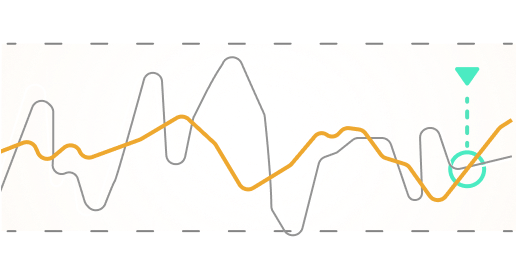
RSI and stochastic RSI
Using both the RSI and SRSI as signals for entering a trade. Closing the trade at a 3:2 risk-reward ratio.
Read More
If the SRSI(14, 1, Fast, 15m, 14, Close) of BTC/USDT crosses below the BTC/USDT RSI(14, 15m, Close) buy 500 USD WORTH of BTC/USDT
Close position at profit of 2% or at loss of 3%
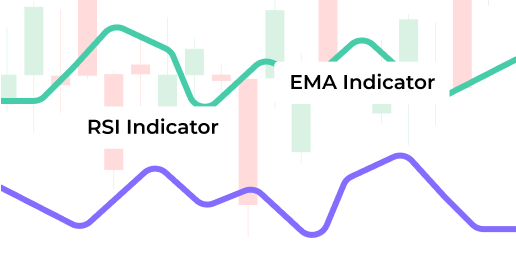
RSI – EMA Combo
If the RSI (Relative Strength Index) crossed below 30 while the price was below the 200 day EMA, this strategy will buy Bitcoin and close the trade once the RSI crossed above 75
Read More
If BTC/USDT RSI(14, Day, Close) crosses below 30 and the price of BTC/USDT is below the EMA(200, Day, Close) buy 0.75 BTC/USDT
Close position if the RSI(14, Day, Close) of BTC/USDT crosses above 75
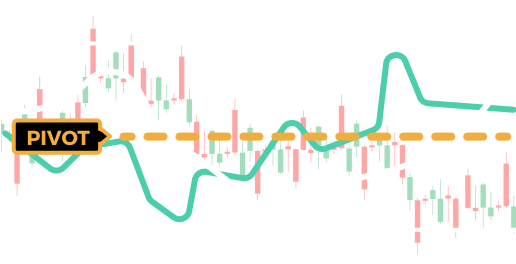
Pivot Lines
Pivot lines act as support and resistance lines. In this strategy, we are looking for the price reaching and touching the weekly pivot and then entering a position
Read More
Buy 300 USD WORTH of BTC/USDT if BTC/USDT crosses below the Pivot(Week)
Close position if BTC/USDT Candlestick(1, Day, High) is below the Pivot(Week)
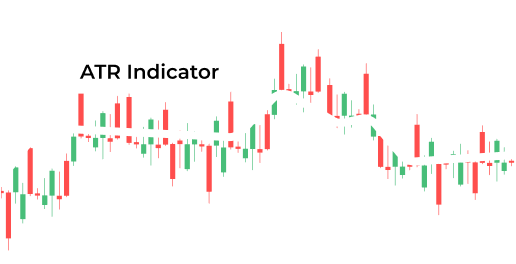
Average True Range
Enter a position if the hourly ATR is larger than the 14 days ATR by more than 10%.
Read More
Buy 10K EUR/USD if EUR/USD 1-hour ATR is higher by more than 10% from EUR/USD 14-day ATR
☑️Skip
MA Crossing
This strategy waits for a trigger once a short moving average of 10 bars crosses above the long moving average of 30 bars
Read More
If BTC/USDT MA(10, 1h, Close) crosses above the BTC/USDT MA(30, 1h, Close) then buy 1,000 USD WORTH of BTC/USDT
Close position if the MA(10, 1h, Close) of BTC/USDT crosses below the BTC/USDT MA(50, 1h, Close) or AT profit above 5%
Bollinger Bands Ping Pong
Entering position When price drops below the lower band on the 1 hour chart. Exiting the trade once the price has returned to the middle Bollinger band or at a loss of 3%
Read More
If BTC/USDT price crosses below the lower BB(20, 1h, 2, Close) buy 5,000 USD WORTH of BTC/USDT
Close position if BTC/USDT is above the middle BB(20, 1h, 2, Close)
MACD VS. the Signal Line
Enter & exit positions based on the MACD indicator. In this example we will enter a long position if the MACD line is above 0 and crossing above the signal line.
Read More
Buy 1,000 USD WORTH of BTC/USDT if the MACD Line(12, 26, 9, 15m, Close) of BTC/USDT crosses above the signal line and the MACD Line(12, 26, 9, 15m, Close) of BTC/USDT is above the zero line
Close position if the MACD Line(12, 26, 9, 15m, Close) of BTC/USDT is below the signal line or profit is at 15% or the loss is at 6%
RSI and stochastic RSI
Using both the RSI and SRSI as signals for entering a trade. Closing the trade at a 3:2 risk-reward ratio.
Read More
If the SRSI(14, 1, Fast, 15m, 14, Close) of BTC/USDT crosses below the BTC/USDT RSI(14, 15m, Close) buy 500 USD WORTH of BTC/USDT
Close position at profit of 2% or at loss of 3%
RSI – EMA Combo
If the RSI (Relative Strength Index) crossed below 30 while the price was below the 200 day EMA, this strategy will buy Bitcoin and close the trade once the RSI crossed above 75
Read More
If BTC/USDT RSI(14, Day, Close) crosses below 30 and the price of BTC/USDT is below the EMA(200, Day, Close) buy 0.75 BTC/USDT
Close position if the RSI(14, Day, Close) of BTC/USDT crosses above 75
Pivot Lines
Pivot lines act as support and resistance lines. In this strategy, we are looking for the price reaching and touching the weekly pivot and then entering a position
Read More
Buy 300 USD WORTH of BTC/USDT if BTC/USDT crosses below the Pivot(Week)
Close position if BTC/USDT Candlestick(1, Day, High) is below the Pivot(Week)
Average True Range
Enter a position if the hourly ATR is larger than the 14 days ATR by more than 10%.
Read More
Buy 10K EUR/USD if EUR/USD 1-hour ATR is higher by more than 10% from EUR/USD 14-day ATR
☑️Skip
Price Action
Monitor for sharp movements in an asset’s price or volume and act precisely at the right moment with automated execution
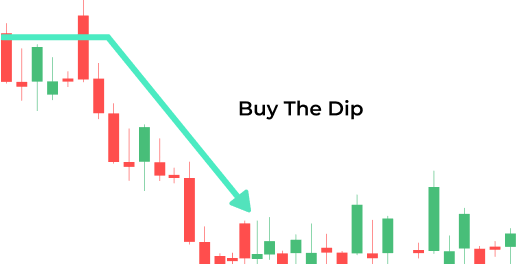
Buy the Dip
At times, we can observe flash crashes that quickly recover. In this example, we wait for a price drop of at least 10% in the last 3–30 minute bars.
This can be applied to any number and type of bars, 20-5 minute bars, 100-1 minute bars, etc.
Read More
If BTC/USDT 3-30m bar change < -10% buy 1,000 USD WORTH of BTC/USDT
Close position at profit of 5% or at loss of 5%
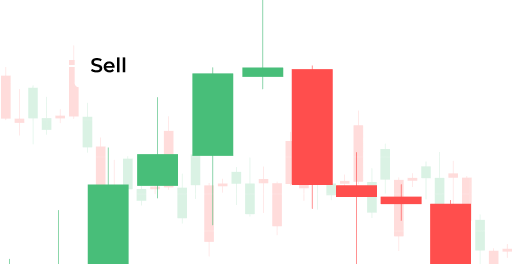
Sell the Top
As there are flash crashes, there are also flash runs. At times, we can observe a flash run in price that quickly turns back. In this example, we wait for a price to raise at least 10% in the last 3–30 minute bars.
This could be applied to any number and type of bars, 20-5 minute bars, 100-1 minute bars, etc.
Read More
If BTC/USDT 3-30m bar change is above 10% sell 1,000 USD WORTH of BTC/USDT
Close position at trailing stop of 2%
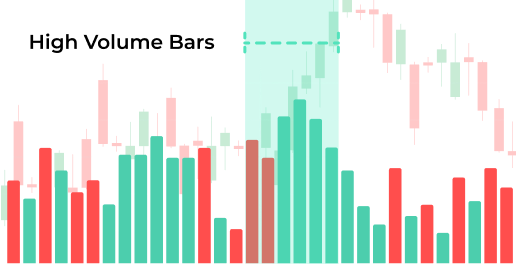
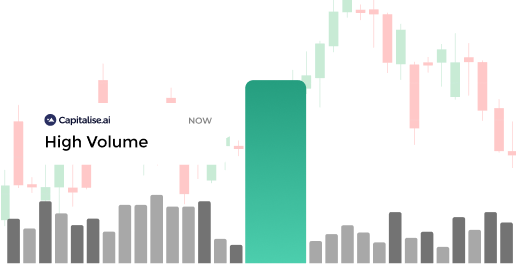
High Volume Bar
A high-volume price movement often indicates pressure points of interest. In this strategy we wish to locate a large volume movement by finding a 1-minute bar if its volume is greater by at least 25% from the last 30 minutes
Read More
If BTC/USDT 1 minute volume > BTC/USDT 30 minute average volume by at least 25% buy 5,000 USD WORTH of BTC/USDT
☑️Skip
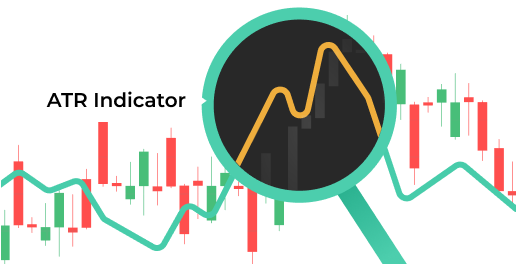
ATR Price Movement
Using the Average True Range indicator, we can presumably identify large price movements. In this example, we find a bar that its range is more than 150% greater than the average range of the 20 bars that preceded it.
We combine it with defining that the last 3 bars should indicate a drop in price.
Read More
If the 1 minute ATR of BTC/USDT is greater by more than 150% from the 20-1m bar ATR of BTC/USDT with an offset of 1 bars and if BTC/USDT 3-1m bar change is negative buy 0.1 BTC/USDT
Close position at trailing stop of 5%
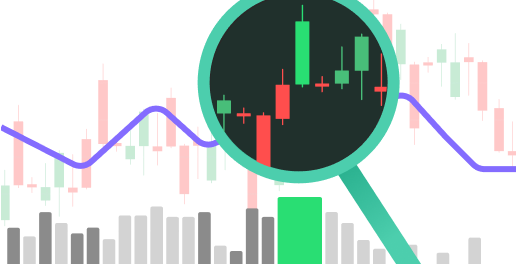
Price Action Combo
This strategy combines multiple price-action indicators including ATR, Volume, Bar-Change and MA
Read More
If the 1 minute ATR of BTC/USDT is greater by more than 150% from the 20-1m bar ATR of BTC/USDT with an offset of 1 bars and if BTC/USDT 1 minute volume > BTC/USDT 30 minute average volume by at least 25% and if BTC/USDT 3-1m bar change is negative and if BTC/USDT price is below BTC/USDT MA(20, 1m, Close) buy 10,000 USD WORTH of BTC/USDT
Close position at profit of 6% or loss is 2%
Buy the Dip
At times, we can observe flash crashes that quickly recover. In this example, we wait for a price drop of at least 10% in the last 3–30 minute bars.
This can be applied to any number and type of bars, 20-5 minute bars, 100-1 minute bars, etc.
Read More
If BTC/USDT 3-30m bar change < -10% buy 1,000 USD WORTH of BTC/USDT
Close position at profit of 5% or at loss of 5%
Sell the Top
As there are flash crashes, there are also flash runs. At times, we can observe a flash run in price that quickly turns back. In this example, we wait for a price to raise at least 10% in the last 3–30 minute bars.
This could be applied to any number and type of bars, 20-5 minute bars, 100-1 minute bars, etc.
Read More
If BTC/USDT 3-30m bar change is above 10% sell 1,000 USD WORTH of BTC/USDT
Close position at trailing stop of 2%
High Volume Bar
A high-volume price movement often indicates pressure points of interest. In this strategy we wish to locate a large volume movement by finding a 1-minute bar if its volume is greater by at least 25% from the last 30 minutes
Read More
If BTC/USDT 1 minute volume > BTC/USDT 30 minute average volume by at least 25% buy 5,000 USD WORTH of BTC/USDT
☑️Skip
ATR Price Movement
Using the Average True Range indicator, we can presumably identify large price movements. In this example, we find a bar that its range is more than 150% greater than the average range of the 20 bars that preceded it.
We combine it with defining that the last 3 bars should indicate a drop in price.
Read More
If the 1 minute ATR of BTC/USDT is greater by more than 150% from the 20-1m bar ATR of BTC/USDT with an offset of 1 bars and if BTC/USDT 3-1m bar change is negative buy 0.1 BTC/USDT
Close position at trailing stop of 5%
Price Action Combo
This strategy combines multiple price-action indicators including ATR, Volume, Bar-Change and MA
Read More
If the 1 minute ATR of BTC/USDT is greater by more than 150% from the 20-1m bar ATR of BTC/USDT with an offset of 1 bars and if BTC/USDT 1 minute volume > BTC/USDT 30 minute average volume by at least 25% and if BTC/USDT 3-1m bar change is negative and if BTC/USDT price is below BTC/USDT MA(20, 1m, Close) buy 10,000 USD WORTH of BTC/USDT
Close position at profit of 6% or loss is 2%
Timing Conditions
Set your trades to execute only if a certain event happens during, before, or after a specific timing.
Trading at a Specific Time
Time your entry & exit in a way that only if a certain event happens at a certain time your orders will be triggered.
In this example, we want to sell BTC at a certain price at 15:55 ET. This strategy will not trigger at any other time.
Read More
At 15:55 Eastern Time if BTC/USDT is below 19,000 buy 1 BTC/USDT
☑️Skip
Trading Before or After a News Event
Use macro-economical events to trigger your entries and exits.
In this example, we want to buy BTC at a certain price before the Average Earnings excl. Bonus, and sell it after the NFP (US) result.
Read More
Before the Average Earnings excl. Bonus (GB) result buy 1 BTC/USDT at limit of 1.2% above the 1-day low
Close position after the NFP (US) result at trailing stop of 2%
Between or Except-Between specific hours
Trade only within a specific time window, or at any time except during specific hours.
In this example, we enter trade if our conditions are met between 9:30 AM and 11:00 AM, then close the position if our conditions occur at any time except between 9:30 AM and 11:00 AM
Read More
Between 9:30 AM and 11:00 AM my time sell 10 ETH/USDT if the 1-hour change of ETH/USDT is above the 1-day change of ETH/USDT by 1%
Close position at trailing stop of 1% except between 9:30 AM and 11:00 AM my time
Smart Trades
Leverage the power of trading automation to support your manual trading activity.
Set one-off trades to be executed automatically when your conditions are met.

Advanced Exit Management
Use a variety of exit scenarios, including Trailing-Stop-Loss, Trailing-Take-Profit, indicators-based exits, timing-conditions etc.
This is an example where we enter a trade at Market (could also be a limit order) and set the exit to use a Trailing-Take-Profit combined with a Stop-Loss.
Read More
Buy 0.35 BTC/USDT
Close position at trailing take profit(5%, 1%) or AT loss of 2%
Dynamic Limit
Set a limit order at a dynamic price that is equal to a changing parameter. For example, we can set a limit order that equals to the moving average or a Bar close rate.
This example shows an entry with a limit that is equal to the lower Bollinger band.
Important to remember that with all limit orders, the price can move in the opposite direction and we might not enter the trade at all. Read more about Dynamic Entry Limit Price.
Read More
if BTC/USDT crosses above the 200 day EMA buy 10,000 USD WORTH of BTC/USDT at limit equals to the lower BB(20, 15m, 2, Close)
Close position when BTC/USDT crosses above the upper BB(20, Day, 2, Close)
Closing a Manual Trade
Close a previously opened trade by using the “Entry” step as a scenario for a trade in the opposite direction.
In this example, we have previously bought 0.5 BTC/USDT and would like to close our trade if the 1-hour RSI crosses above 80. Leave the “Exit” step empty by ticking the “Skip the exit strategy” checkbox.
Read More
If BTC/USDT RSI (14,1h,Close) crosses above 80 sell 0.5 BTC/USDT
☑️Skip
Candlestick Patterns
Monitor for chart patterns by referring to historical bars
3-Bar Reversal
This is a 3-bar reversal strategy, it enters a long position once the pattern has been identified. The same logic could be applied for writing a strategy that locates a short opportunity.
Read More
if BTC/USDT bar(1, 1h, Close) with an offset of 2 bars is below BTC/USDT bar(1, 1h, Open) with an offset of 2 bars and if BTC/USDT bar(1, 1h, Close) with an offset 1 bars is below BTC/USDT bar(1, 1h, Close) with an offset of 2 bars and if BTC/USDT previous 1 hour bar close is above BTC/USDT bar(1, 1h, Open) with an offset of 1 bars then buy 10 BTC/USDT
close position at trailing stop of 2%
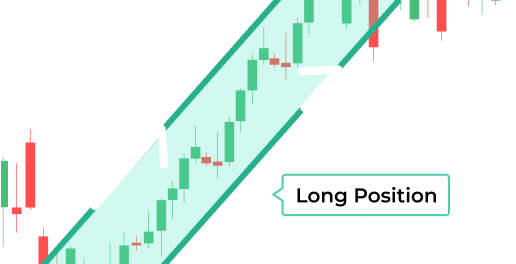
Channel Trading Part 1 - Long
In cases we would like to trade within a channel, a strategy can run in a loop and make sure we buy in at the bottom and close at the top. We can then set up another strategy to sell at the top and close at the bottom.
In this example, assuming we have a channel of Bitcoin between $18,000 and $20,000 we would define this strategy (Part 1) to buy at $18,001 and sell at $19,999 with a stop loss at $500. We’ll use the second strategy (Part 2) to do the opposite.
Read More
If BTC/USDT is below 18,001 buy 1 BTC
Close position if BTC/USDT is above 19,999 or if BTC/USDT is below 17,500
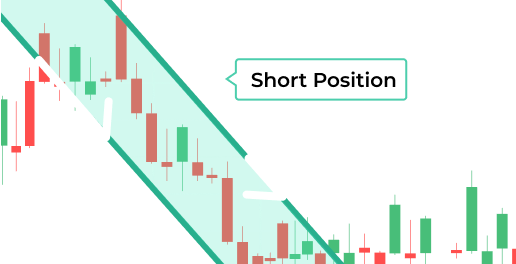
Channel Trading Part 2 - Short
This is an opposite strategy to the "Channel Trading Part 1". assuming we have Bitcoin moving in a channel between $18,000-$20,000, we would define this strategy to sell at $19,999 and buy at $18,001 with a stop loss at $500.
Read More
If BTC/USDT is above 19,999 sell 1 BTC
Close position if BTC/USDT is below 18,001 or if BTC/USDT is above 20,500
3-Bar Reversal
This is a 3-bar reversal strategy, it enters a long position once the pattern has been identified. The same logic could be applied for writing a strategy that locates a short opportunity.
Read More
if BTC/USDT bar(1, 1h, Close) with an offset of 2 bars is below BTC/USDT bar(1, 1h, Open) with an offset of 2 bars and if BTC/USDT bar(1, 1h, Close) with an offset 1 bars is below BTC/USDT bar(1, 1h, Close) with an offset of 2 bars and if BTC/USDT previous 1 hour bar close is above BTC/USDT bar(1, 1h, Open) with an offset of 1 bars then buy 10 BTC/USDT
close position at trailing stop of 2%
Channel Trading Part 1 - Long
In cases we would like to trade within a channel, a strategy can run in a loop and make sure we buy in at the bottom and close at the top. We can then set up another strategy to sell at the top and close at the bottom.
In this example, assuming we have a channel of Bitcoin between $18,000 and $20,000 we would define this strategy (Part 1) to buy at $18,001 and sell at $19,999 with a stop loss at $500. We’ll use the second strategy (Part 2) to do the opposite.
Read More
If BTC/USDT is below 18,001 buy 1 BTC
Close position if BTC/USDT is above 19,999 or if BTC/USDT is below 17,500
Channel Trading Part 2 - Short
This is an opposite strategy to the "Channel Trading Part 1". assuming we have Bitcoin moving in a channel between $18,000-$20,000, we would define this strategy to sell at $19,999 and buy at $18,001 with a stop loss at $500.
Read More
If BTC/USDT is above 19,999 sell 1 BTC
Close position if BTC/USDT is below 18,001 or if BTC/USDT is above 20,500
Dollar Cost Averaging
Invest equal amounts at regular intervals automatically
Volume Splitter
In volatile markets, we might want to spread high-volume trades into multiple smaller ones. This strategy sells 0.03 BTC/USDT every minute.
If you skip the exit strategy and set it to run in-loop for a total of 100 hits, it will eventually sell 3 Bitcoins in the course of 1 hour and 40 minutes.
Read More
After 1 minutes from entry starts sell 0.03 BTC/USDT
☑️Skip
Long Term Investment
When we simply wish to increase our holding in an asset systematically, This strategy buys $500 BTC/USDT every 30 days.
Read More
Buy $500 WORTH of BTC/USDT after 30 days from entry starts
☑️Skip
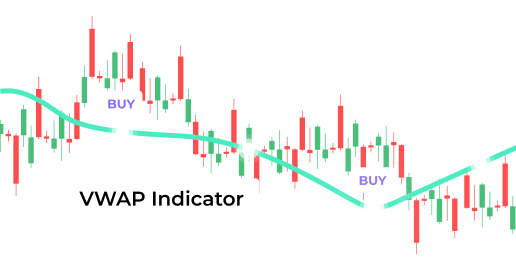
VWAP Buying Loop
Create a strategy that buys into the market at regular time intervals, but only when the price is below the Volume Weighted Average Price. Use a TradingView Alert to trigger the
entry only when the price is below the Volume Weighted Average Price. To create recurring entries, make sure to skip the Exit strategy and set the strategy to run in-loop.
Read More
Buy 1,000 USD WORTH of BTC/USDT 5 minutes after entry starts if Webhook triggers
☑️Skip
Volume Splitter
In volatile markets, we might want to spread high-volume trades into multiple smaller ones. This strategy sells 0.03 BTC/USDT every minute.
If you skip the exit strategy and set it to run in-loop for a total of 100 hits, it will eventually sell 3 Bitcoins in the course of 1 hour and 40 minutes.
Read More
After 1 minutes from entry starts sell 0.03 BTC/USDT
☑️Skip
Long Term Investment
When we simply wish to increase our holding in an asset systematically, This strategy buys $500 BTC/USDT every 30 days.
Read More
Buy $500 WORTH of BTC/USDT after 30 days from entry starts
☑️Skip
VWAP Buying Loop
Create a strategy that buys into the market at regular time intervals, but only when the price is below the Volume Weighted Average Price. Use a TradingView Alert to trigger the
entry only when the price is below the Volume Weighted Average Price. To create recurring entries, make sure to skip the Exit strategy and set the strategy to run in-loop.
Read More
Buy 1,000 USD WORTH of BTC/USDT 5 minutes after entry starts if Webhook triggers
☑️Skip
TradingView Alerts Webhook
Trigger your strategies based on any TradingView alert, using our TradingView webhook conditions.

Simple Webhook Trigger
This strategy triggers a market order when your selected TradingView alert is recieved.
Read More
If Webhook triggers buy 1 BTC/USDT
☑️Skip

Multiple Alerts Combination
Combine multiple conditions and alerts to customize your strategy.
This example combines 2 TradingView alerts with the Capitalise.ai EMA indicator.
Read More
If Webhook triggers and if Webhook triggers and if BTC/USDT is below the EMA (200,Day,Close) of BTC/USDT buy 0.2 BTC/USDT
☑️Skip

Manage Multiple Strategies
A single TradingView Alert can trigger multiple strategies across multiple accounts. This can be used to manage trading for friends and family.
They can create a strategy that has 1 condition on the entry and 1 condition on the exit, which are the webhook triggering condition. They then send you the Webhook ID’s and in turn, you can trigger their strategies for them.
Read More
If Webhook(0cb6245d-2588-4f9a-b35b-xxxxxxxxxxx) triggers buy 0.5 BTC/USDT
Close position if Webhook(8c0fecfa-92d9-4e5b-xxxxxxxxxxx) triggers
Simple Webhook Trigger
This strategy triggers a market order when your selected TradingView alert is recieved.
Read More
If Webhook triggers buy 1 BTC/USDT
☑️Skip
Multiple Alerts Combination
Combine multiple conditions and alerts to customize your strategy.
This example combines 2 TradingView alerts with the Capitalise.ai EMA indicator.
Read More
If Webhook triggers and if Webhook triggers and if BTC/USDT is below the EMA (200,Day,Close) of BTC/USDT buy 0.2 BTC/USDT
☑️Skip
Manage Multiple Strategies
A single TradingView Alert can trigger multiple strategies across multiple accounts. This can be used to manage trading for friends and family.
They can create a strategy that has 1 condition on the entry and 1 condition on the exit, which are the webhook triggering condition. They then send you the Webhook ID’s and in turn, you can trigger their strategies for them.
Read More
If Webhook(0cb6245d-2588-4f9a-b35b-xxxxxxxxxxx) triggers buy 0.5 BTC/USDT
Close position if Webhook(8c0fecfa-92d9-4e5b-xxxxxxxxxxx) triggers
Smart Notifications
Let Capitalise monitor real-time market data, technical indicators & macroeconomics 24/7 so you don’t have to.
Price Alert
Get notified once the price of an asset hits a specific target
Read More
notify me if BTC/USDT breaks above 32,000
☑️Skip
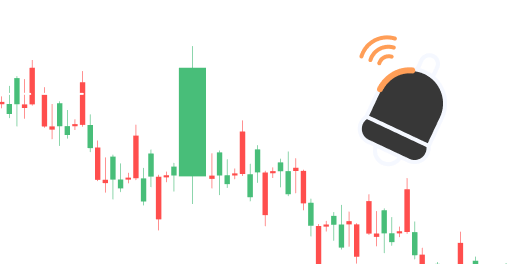
Extreme Volume Alert
Get notified every time there is an unusual high volume. When using this example or any repetitive scenario, turn on the "run in loop" mode
Read More
after 3 minutes from entry starts notify me if BTC/USDT 1 minute volume > BTC/USDT 30 minute average volume by at least 25%
☑️Skip
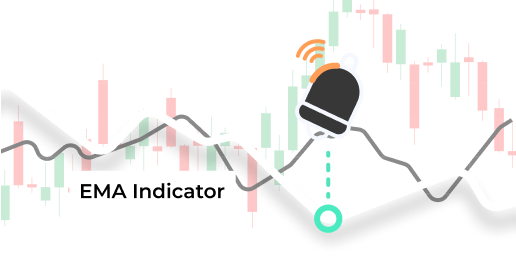
Crossing above the 200 daily EMA
Get notified when the price of an asset crosses above the Exponential Moving Average of 200 daily bars.
Read More
notify me if BTC/USDT crosses above the EMA(200, Day, Close)
☑️Skip
Large Price Movement
Get notified every time the price has changed extensively, based on the ATR indicator. When using this example or any repetitive scenario, turn on the "run in loop" mode
Read More
after 10 minutes from entry starts if the 1 minute ATR of BTC/USDT is greater by more than 200% from the 20-1m bar ATR of BTC/USDT with an offset of 1 bars notify me
☑️Skip
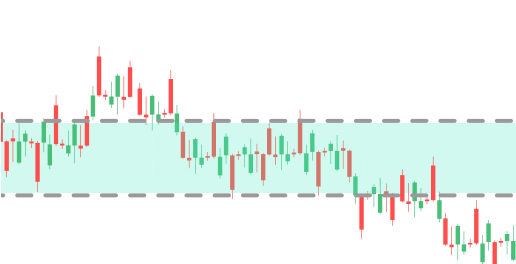
Channel Detection
Get notified if multiple bars have traded below a certain price level and above a second level for a predefined period. In this example, if 24 1-hour bars (24 hours) were below 23,500 and above 22,500.
Read More
notify me if the 24-1h bar high of BTC/USDT is below 23,500 and if the 24-1h bar low of BTC/USDT is above 22,500
☑️Skip
MA Short Over Long
Get notified once a short moving average crosses a longer moving average.
Read More
notify me if the EMA(9, 15m, Close) of BTC/USDT crosses above the MA(50, 15m, Close)
☑️Skip
Price Alert
Get notified once the price of an asset hits a specific target
Read More
notify me if BTC/USDT breaks above 32,000
☑️Skip
Extreme Volume Alert
Get notified every time there is an unusual high volume. When using this example or any repetitive scenario, turn on the "run in loop" mode
Read More
after 3 minutes from entry starts notify me if BTC/USDT 1 minute volume > BTC/USDT 30 minute average volume by at least 25%
☑️Skip
Crossing above the 200 daily EMA
Get notified when the price of an asset crosses above the Exponential Moving Average of 200 daily bars.
Read More
notify me if BTC/USDT crosses above the EMA(200, Day, Close)
☑️Skip
Large Price Movement
Get notified every time the price has changed extensively, based on the ATR indicator. When using this example or any repetitive scenario, turn on the "run in loop" mode
Read More
after 10 minutes from entry starts if the 1 minute ATR of BTC/USDT is greater by more than 200% from the 20-1m bar ATR of BTC/USDT with an offset of 1 bars notify me
☑️Skip
Channel Detection
Get notified if multiple bars have traded below a certain price level and above a second level for a predefined period. In this example, if 24 1-hour bars (24 hours) were below 23,500 and above 22,500.
Read More
notify me if the 24-1h bar high of BTC/USDT is below 23,500 and if the 24-1h bar low of BTC/USDT is above 22,500
☑️Skip
MA Short Over Long
Get notified once a short moving average crosses a longer moving average.
Read More
notify me if the EMA(9, 15m, Close) of BTC/USDT crosses above the MA(50, 15m, Close)
☑️Skip